Users will be able to switch the contents by clicking those tabs listed below.
The possible actions that an user can do will be introduced in the next content."Main" tab leads an user to main system page, and this tab is selected by default.
"Version 2" tab leads an user to previous version of "GALAXY".
The new browser tab will be opend automatically to display that.
"Manual" tab leads an user to system manual page(now you are checking).
"About" tab leads an user to the document which describes the detail about the research background.
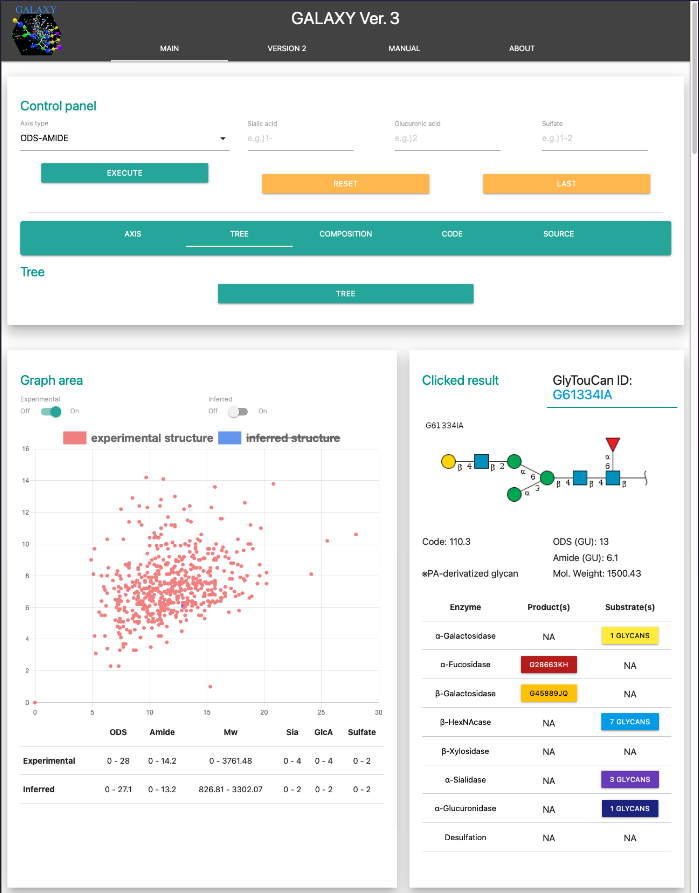
An user will be able to select axis type of the graph at the middle.
These are the available options.
An user will be able to filter the data by sialic acid.
It will consider the content of "N-Acetylneuraminic acid" and "N-Glycolylneuraminic acid".
The form will accept these string patterns.
An user will be able to filter the data by glucuronic acid.
It will consider the content of "D-Glucopyranuronic acid".
The form will accept these string patterns.
An user will be able to filter the data by sulfation.
It will consider the content of "6-O-sulfate"(6S).
The form will accept these string patterns.
The system has two useful functions.
Once this function is called, all form will be cleared and the graph will be generated with original data again.
UNDER DEVELOPMENT
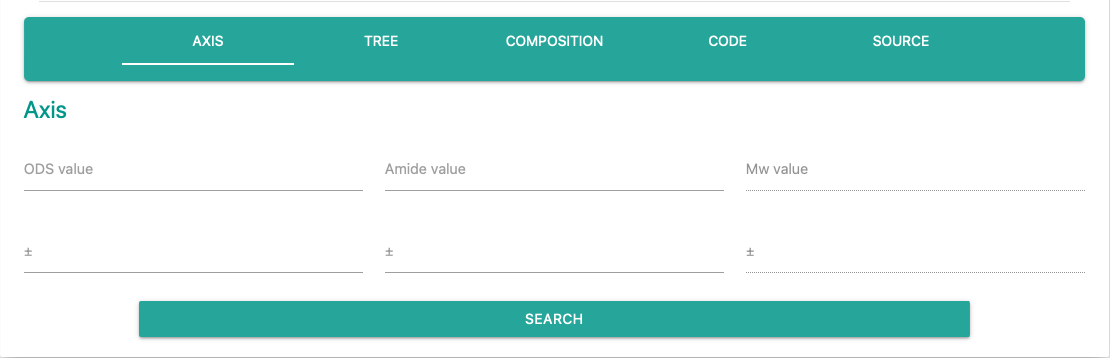
The axis form will accept four values at one time.
Only the forms corresponding to the selected axis type are fillable.
Respective "Value" specifies standard value, and "Range" accepts margin.
For example, if 10 is given for ODS value and 1 is given for ODS range, the system will filter data which ODS value is 9 - 11.
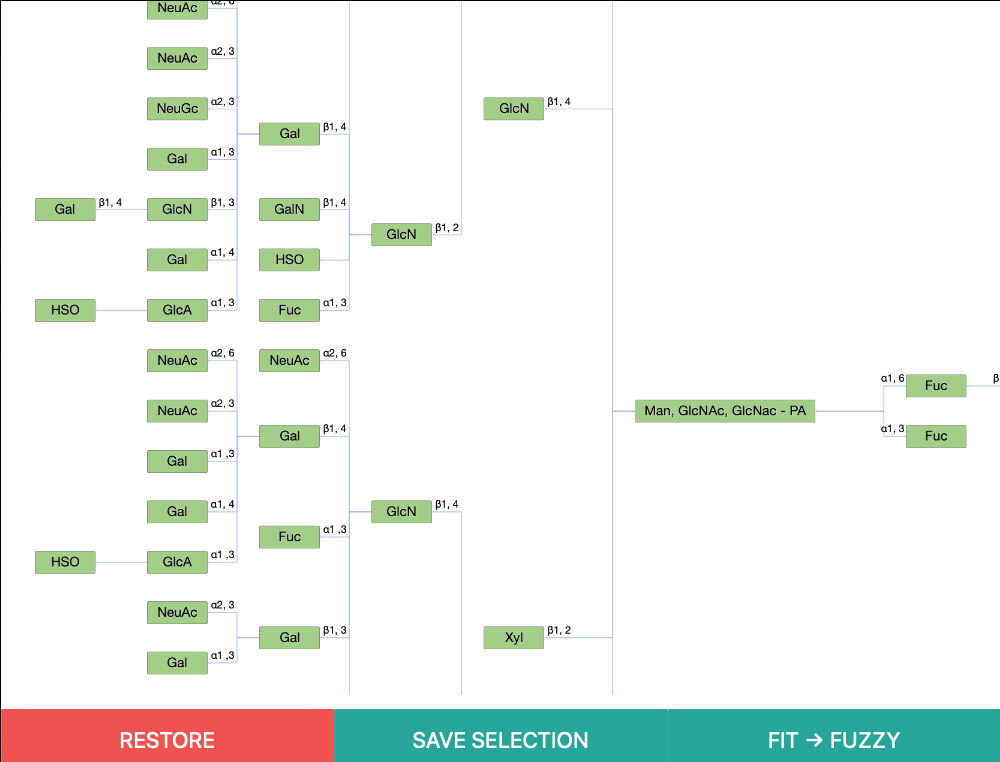
An user can open tree map at external window like the image above.
The procedure of tree search is following these orders.
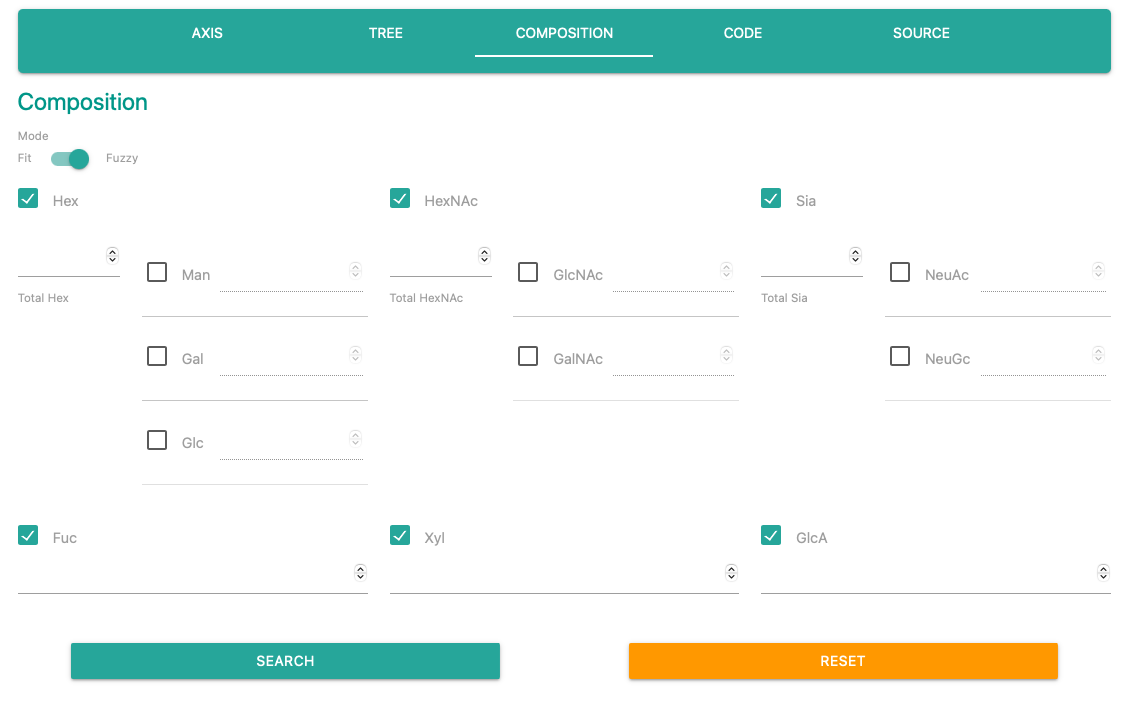
Composition search form accepts numbers of each monosaccharide.
The forms will not be appeared unless an user will check the box next to the category name.
※Even numbers are filled in the forms, the system will reffer condition of a checked monosaccharide.
"Composition search" also has two search mode.
An user will be able to search by code.
The code list is available from this link(download CSV).
※The code is determined by following the rule described here.
UNDER DEVELOPMENT
An user will be able to switch whether displaying "Experimental dataset" on the graph or not.
An user will be able to switch whether displaying "Inferred dataset" on the graph or not.
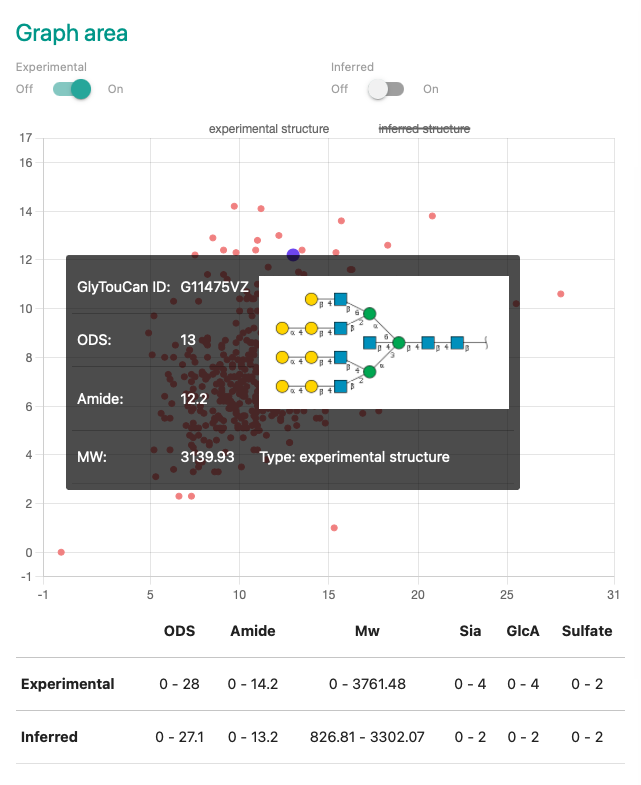
Plot area displays data by two dimentional graph.
There are some features for this area.
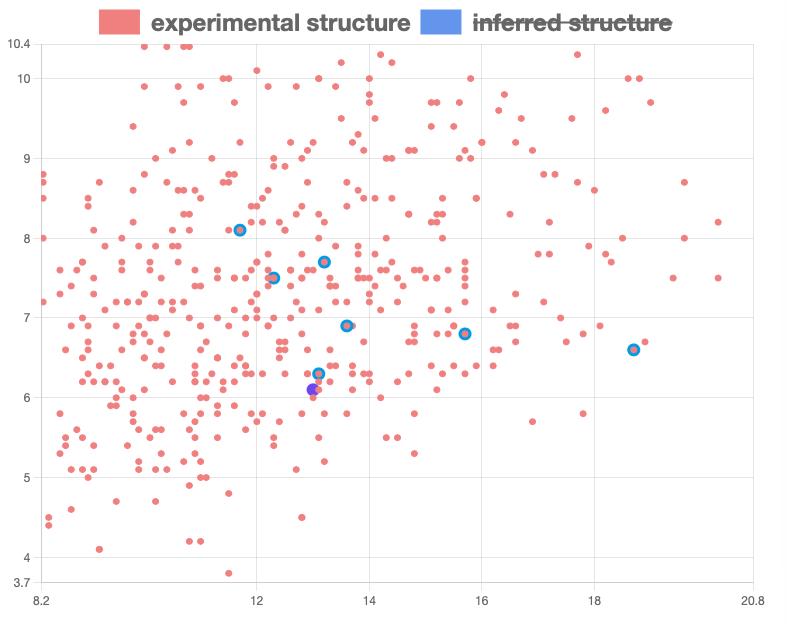
Plots are colored by one of those below.
Plot border is colored by one of those colors when enzyme relation is highlihgted.
Range information table is placed under the graph.
The table shows the brief information of genral parameters in the format below.
"minimum - maximum"
The data is separated by the dataset type.
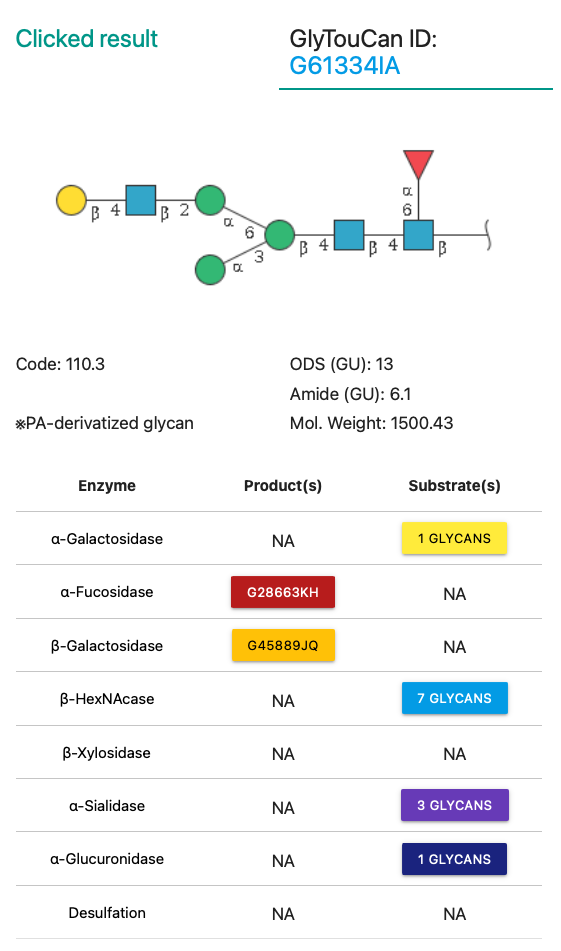
Mapped GlyTouCan ID is displayed on the top of the result area.
Target link is opened at an external tab on your web browser.
※What is GlyTouCan?
Glycan Image is generated with Symbol Nomenclature for Glycans(SNFG).
Eight kinds of enzyme are listed in the table, and all of them are clickable if the glycan has product or substrate.
The clicking will highlight those product or substrate on the graph with a style described here.
Example highlight is looked like the figure below.
If a glycan has a product by processing with an enzyme, its GlyTouCan ID would be appeared as a botton.
By hovering the cursor on the botton, an user will be able to check the glycan image.
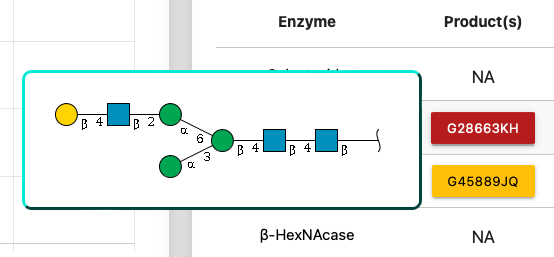
Moreover, clicking the botton triggers showing up of the modal window for checking more information briefly.
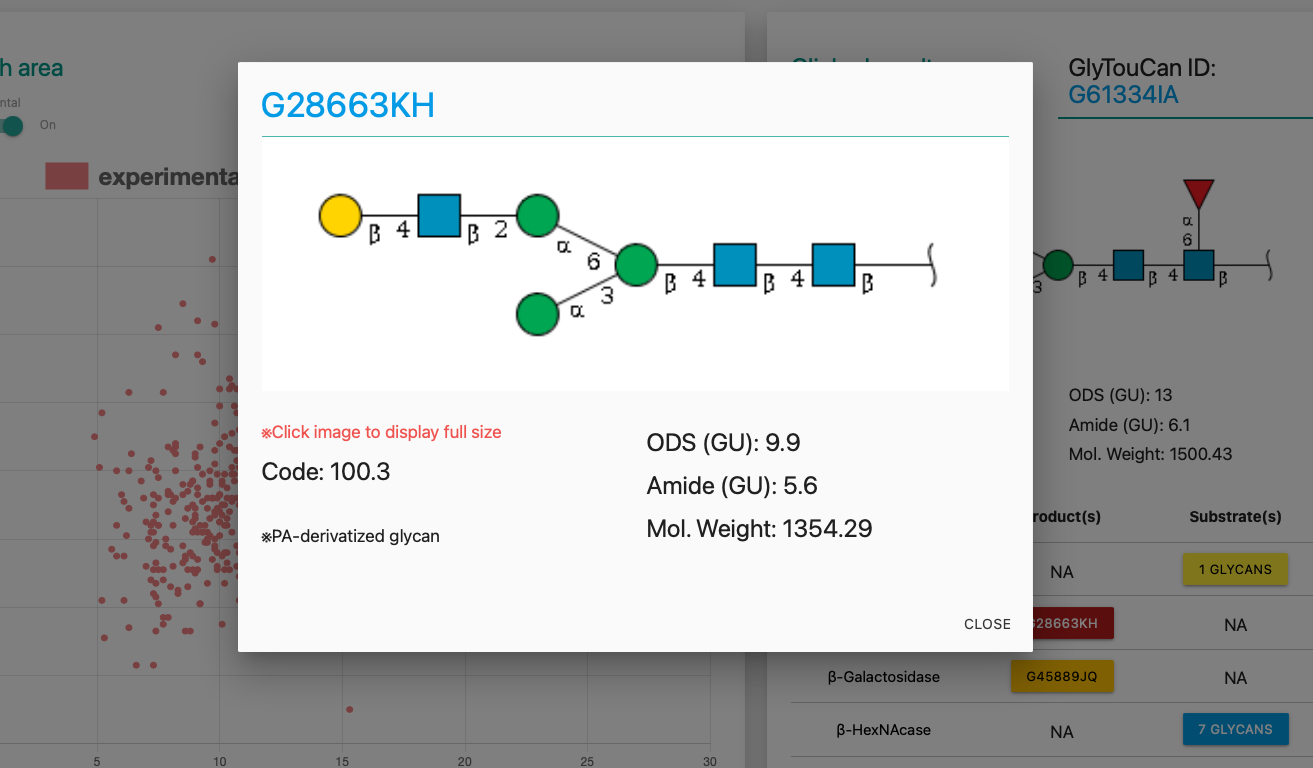
If a glycan has a substrate by processing with an enzyme, its GlyTouCan ID would be collected in a drop-down button.
After opening the drop-down, by hovering the cursor on the GlyTouCan ID, an user will be able to check the glycan image.
Moreover, clicking the botton triggers showing up of the modal window for checking more information briefly.
Those features are the same as described in the product section.